Emulation Debugging
Emulation is used much earlier than traditional FPGA prototyping in the verification process. For example Simulation acceleration is considered as soon as major blocks of SoC are available. For this reason advanced debugging capabilities are needed to trace problems and find bugs while running emulation instead of rolling back to pure HDL simulation. Addressing these requirements, Aldec’s HES-DVM™ contains a complete set of tools and functions such as:
- Debug Probes with HVD technology assuring 100% signals visibility
- Triggers & Breakpoints to control debug process and narrow down amount of debug data to analyze
- Memory Visibility interface with read and write access to emulated design memory blocks
- HW Debugger tool – GUI frontend to all debugging functions
- HES Debug API – the unique feature that allows controlling all debug functions from C/C++ code
Debug Probes
Debug probes feature is required to capture design signals’ values while running emulation and save the waveform database for post-emulation debug.
The HES-DVM supports two kinds of debug probes, which are static and dynamic ones that enable setting desired tradeoff between speed and visibility. In both cases the HES-DVM assures automatic RTL source code instrumentation and true RTL view, which means that all signal names, data types and hierarchy paths are preserved and displayed as in HDL simulator. Debug probes are sampled using one of design clocks and user can change at runtime which one to use. The HES-DVM supports two waveform formats which are ASDB which can be loaded in Aldec’s Riviera-PRO or Active-HDL and FSDB which can be loaded in Synopsys Verdi tool. The VCD waveform can be obtained by conversion from ASDB. Debugging data is acquired from the emulator board using fast PCIe host interface.
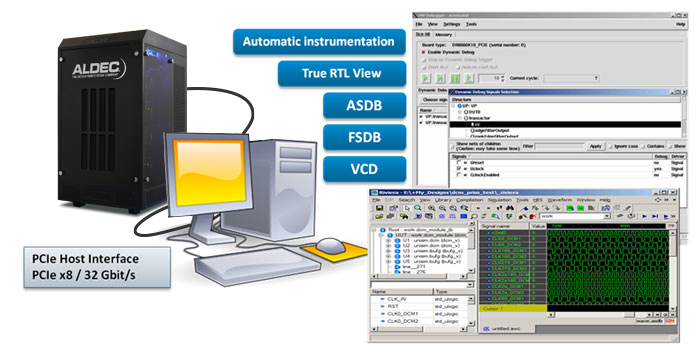
Essential Features:
- True RTL View of emulated design
- Automated RTL code instrumentation
- Compatible with various debugging tools (ASDB, FSDB, VCD waveforms)
- Runtime reconfiguration
- PCIe based host connection for fast debugging data delivery
Static Probes
The Static Probes feature is realized as the on-chip logic analyzer and so it provides features characteristic to this kind of tools. Aldec’s unique implementation of Advanced Logic Analyzer (ALA) supports seamless multi-FPGA operation with flexible sample buffers that are local in each FPGA and high throughput host interface over PCIe.
Static probes have to be selected during design setup flow before running synthesis, hence the static term. The ALA provides the unprecedented capacity up to 256 Kbits of debug probes that can be scattered in all FPGA partitions. Static probes are organized in data and trigger groups that can be selected and configured at emulation runtime.
| Data Groups | Trigger Groups | |
|---|---|---|
| Number of Groups | 16 | 32 |
| Number of probes per group | 16 Kbit | 256 Bit |
| Total number of probes | 256 Kbit | 8 Kbit |
Additionally, the user can tweak debugging process via probes qualification expression or specifying the time range when samples are captured. In any case the ALA assures no sample dropped off as emulation clocks can be automatically stalled when debug buffers are fully loaded.
Essential Features:
- Fast, at-speed debugging – probing in FPGA, on-chip sample buffers
- Multi-FPGA support
- Flexible probes – selectable data groups, unprecedented capacity
- Runtime configurable sampling clock
- Powerful filters with sample qualification expression
- Continuous capture mode with no sample drop-off
- Automatic integration with design’s logic in each partition
 Dynamic Probes
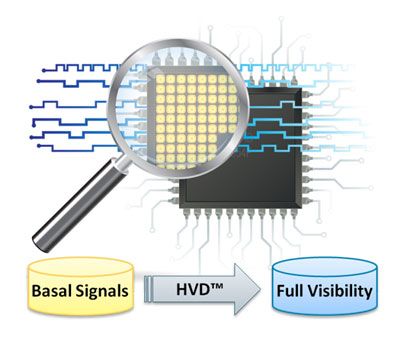
Dynamic Probes feature enables 100% visibility and it is based on the unique HVD technology (Hardware-based Visibility Debugging). The HVD algorithms are used to automatically analyze and find out Basal Probes being the minimum subset of design signals that should be captured from hardware in order to provide full visibility.
The greatest advantage of Dynamic Probes is that user does not have to know upfront which signals are required to diagnose given problem. Instead, any design signal can be selected for debugging during emulation runtime. The HVD expands preserved basal signals assuring visibility of any design node.
Essential Features
- HVD technology for intelligent probing and capturing minimum dataset
- Automatic mapping to RTL names
- Dynamic and interactive probes selection
- On-demand enabling/disabling the process
Download Interactive Presentation
Triggers & Breakpoints
When debugging complex SoC it is required to check for different conditions to decide whether or not to capture debugging data. Acquiring complete design dataset (100% of signals) is not practical, as with millions of signals the amount of debug data would be overwhelming for any kind of emulator. Triggers and Breakpoints bring intelligence and controllability to the debugging process. The trigger, same as in logic analyzer, is used to release collected samples of static probes, whereas the breakpoint stops emulation clocks and returns control to the user.
Aldec’s HES-DVM supports creating complex trigger and breakpoint conditions based on Static Probes and soft-breakpoints based on Dynamic Probes. The conditions are either Boolean or sequence expressions with a complete set of relational operators. All triggers and breakpoint conditions can be enabled, disabled and reconfigured at runtime.
Essential Features:
- Large number of trigger ports (32)
- Multi-FPGA support
- Boolean and Sequence expressions
- Programmable counters
- Configurable trigger position
- Triggers and breakpoints checked at emulation speed
Memory Visibility
Memory blocks are present in any kind of digital circuit design. In SoCs they are used intensively not only as local data storage but often as key elements of the microprocessor sub-systems. Thus visibility of memory contents is essential for verification of both hardware and embedded software. Memory viewers are becoming first and foremost tools in hands of hardware and software developers.
Aldec’s HES-DVM provides models with a back-door interface for debugging that allows reading and writing on-chip memory data while running emulation. The HES-DVM provides a reach library of various standard memory models that depending on size can be mapped either into FPGA RAM-blocks or external on-board DDR3 resources. During emulation, given memory is selected by its hierarchical name as derived from RTL source code. Physical address and the data organization are preserved in the user interface despite of actual FPGA implementation.
Essential Features:
- Memory flow available in HES-DVM when running design emulation setup
- Memory models have a back-door interface for debugging
- Provide read & write access at emulation runtime
- Memories in emulation are identified with original RTL hierarchy paths
- Using physical addressing and data organization to access memory contents
- Single cell and block access with data file
- Convenient for program and data memory initialization in SoC bringup
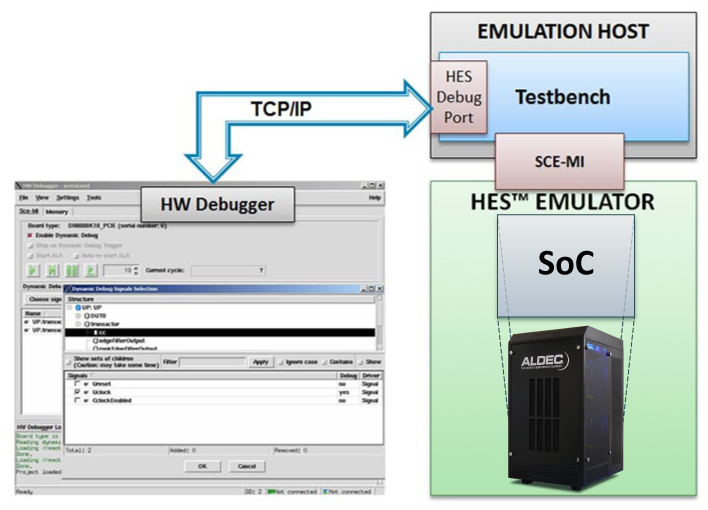
HW Debugger
The HW Debugger tool provides a GUI for all emulation debugging functions. It connects to emulation target using a TCP/IP socket, so it is possible to run it either in the emulation host workstation or even remotely from the desktop computer. The HW Debugger is available both on Linux and MS Windows operating systems and allows for cross-platform operation.
Essential Features:
- GUI interface for all debugging functions (probes, triggers, breakpoints, sampling clock)
- Emulation clocks control (stop, run, run for/until)
- Memory viewer with file read/write and rich display options (radix, value, string)
- RTL View of design structure and signals
- List of selected dynamic probes and current value
- Runtime options reconfiguration
- Scripting commands for automation
HES Debug API
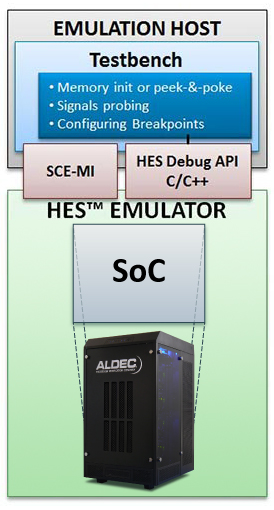 The HesDebugApi is a library with interface in “C” that can be used in any application capable of linking C or C++ objects. The library supports all debugging functions of HES-DVM and so it is an alternative interface to HW Debugger GUI. Using the HES Debug API is a convenient way of developing powerful and interactive testbenches that can initialize on-chip memories, probe internal registers or even configure breakpoints dynamically. With this unique feature, the verification engineers not anymore have to treat design in emulation box as a black-box.
Essential Features:
- C-API easily integrated with any testbench or application (C, C++, SystemC, SV DPI-C, Tcl, Python)
- Enables white-box testing methodologies for emulation
- Direct access to debug probes and memories in emulation
- Fast interface for demanding applications
Corporate Headquarters
2260 Corporate Circle
Henderson, NV 89074 USA
Tel: +1 702 990 4400
Fax: +1 702 990 4414
https://www.aldec.com
©2026 Aldec, Inc.