Debugging C/C++ Applications
Introduction
Active-HDL provides a debugging tool for users who need to verify VHPI/PLI applications attached to VHDL or Verilog designs. The C Code Debug option allows designers to debug DLLs being a part of the design. The simulation of the design along with the VHPI/PLI application is performed within the VSimSA environment through the built-in VHPI/PLI interface. The VHPI/PLI applications can be debugged by using the HDL Editor and C Code Debug windows and the simulator's output can be observed in the VSimSA window.
The HDL Editor allows inserting breakpoints and tracing C/C++ code while the Console window allows entering and executing Gdb commands as well as viewing messages generated during the debugging session. To debug a DLL file, it should be compiled with the GCC-compatible compiler producing the Gdb-compatible debug data.
The installation program of Active-HDL installs tools that allow compiling and debugging C/C++ source code. The compiler (gcc.exe) and the debugger (gdb.exe) are parts of MinGW (Minimalist GNU for Windows Edition ver. 2.0.0) and they are installed in the \MinGW\bin subdirectory of the Active-HDL installation.
Using the hex2bin_bde sample design, this application note will guide you through the process of C/C++ code debugging, and allow you to become familiar with the capabilities of C/C++ compilation in Active-HDL.
NOTES:
In order to use the C Code Debug option, the license for the batch mode simulation (VSimSA) is required.
To enable the debug, -g3 should be added to the compilation options in the C/C++ Configuration dialog box.
Loading sample design
The first step is to load the hex2bin_bde sample design. To open it, choose Open Workspace/Design Explorer from the File menu. Then, double-click the hex2bin_bde workspace icon (\Samples\Verilog_Designs).
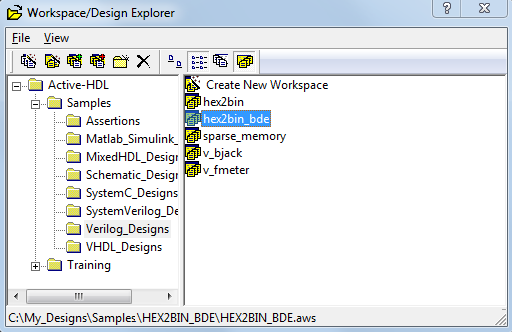
Figure 1. Workspace/Design Explorer
The workspace you have just opened contains the design that needs to be compiled before you proceed with the simulation. To compile it, choose the Compile All command from the Design menu.
After the successful compilation, set the top-level by clicking the Top-Level Selection list box and selecting the UUT_PLI unit as it is shown in the figure below.
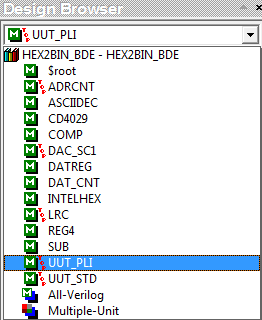
Figure 2. UUT_PLI Top-Level Selection
Setting C Code Debug Options
Choose the Settings option under the Design menu. The Design Settings dialog window opens. Switch to the C Code Debug Settings category. It provides configuration options that will be used while initializing the debugging session of your C/C++ application. Now, we will set options for the C/C++ debugging session.
Use the settings as it is shown in the figure below.
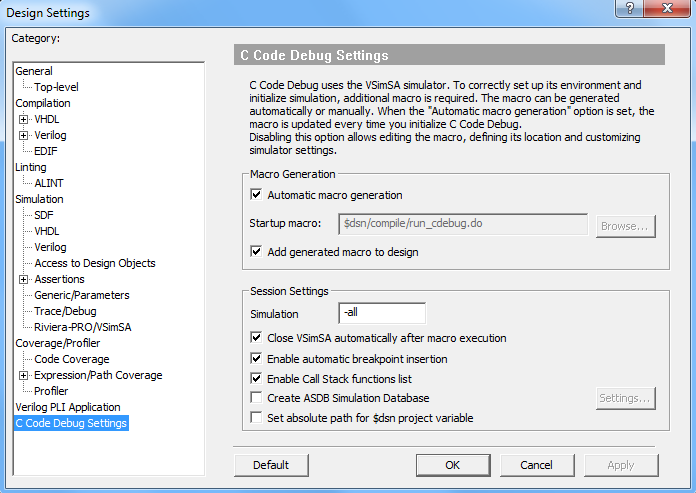
Figure 3. C Code Debug Settings
In this window, we specify options that among others will create and automatically add the generated macro to the design.
In the Verilog PLI Application category, the list of DLL files is displayed. A PLI application is displayed in this category if you have added a DLL file.
In VHDL designs, VHPI applications are registered through architecture with a foreign attribute. The attribute is declared in the standard package of the std library. The foreign architecture could be defined as follows:
architecture <architecture_name> of <entity_name> is

  attribute FOREIGN of <architecture_name>: architecture is

  "VHPI <library_name>; <model_name>";
For additional information on the options of the C Code Debug Settings category of the Design Settings window or Using VHPI Applications, see the Active-HDL on-line documentation.
Click OK to close the dialog.
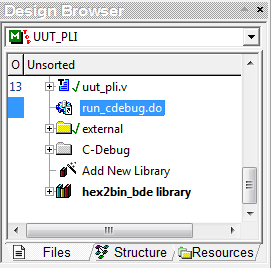
Figure 4. run_cdebug.do macro
After the settings of the debugging session have been specified and you have closed the Design Settings window, the run_cdebug.do macro file that has been specified in the Startup Macro field is attached to the design tree, which is presented in the figure above.
Initialization of Debugging Session
To initialize the debugging session, choose the Initialize C Code Debug option under the Simulation menu. It starts the VSimSA simulator in a separate command prompt window and opens the C Code Debug window in Active-HDL as well as the HDL Editor window with a C/C++ source code. During the initialization of the debugging session, VSimSA displays in the command prompt window information on simulation environment, working library, and loaded VHPI/PLI library.
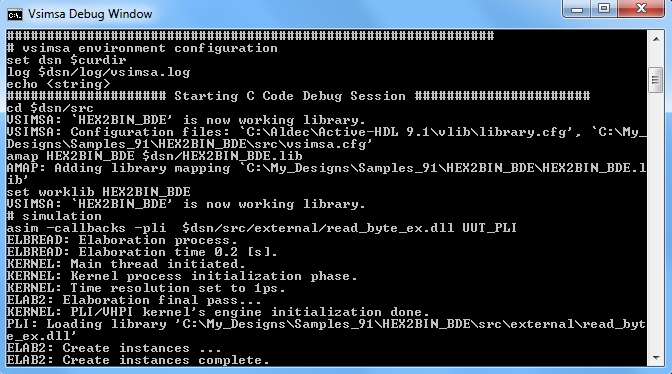
Figure 5. VSimSA Command Prompt Window
The Console window displays additional messages related to breakpoints that have been set:
# C Code Debug: Automatic breakpoint insertion enabled.

# C Code Debug: C Code Debug session has been started.
The Source files tab of the C Code Debug window lists all source files that have been compiled. By double-clicking a source file, you can open it in the HDL Editor that supports C/C++ syntax and keyword coloring, allows setting breakpoint and tracing a code.
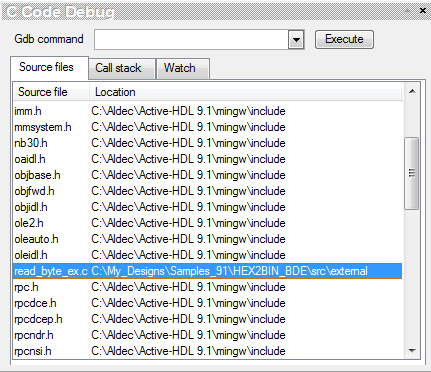
Figure 6. C Code Debug window
After the debugging session has been initialized, the C/C++ source file is loaded and breakpoints are set automatically.
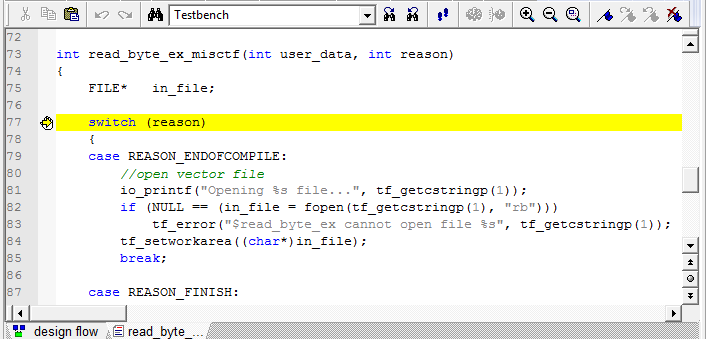
Figure 7. HDL Editor with set breakpoint
If required, you can set your own breakpoints by pressing F9 or choosing Toggle Breakpoint
 from the Simulation menu. Setting breakpoint will be reported in the Console window:
# C Code Debug: C breakpoint id c.11 has been set: file: 'C:\My_Designs\HEX2BIN_BDE\src\external\read_byte_ex.c' line '74' function 'read_byte_ex_misctf'
The list of breakpoints that have been set is available in the Breakpoints window (Simulation | Breakpoints).
Executing Gdb Commands
The C Code Debug window allows entering the Gdb commands to control the debugging session. In this application note, we will start the session by using the continue Gdb command.
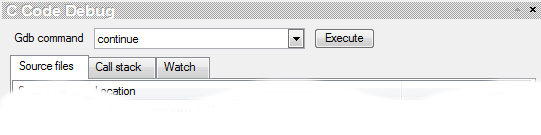
Figure 8. Gdb Command Field
Type in continue in the Gdb command field and press Execute. The command continues a program being debugged that has been suspended by a breakpoint. When the command is issued, the debugger starts and the HDL Editor displays the yellow debug line that is set on the encountered breakpoint in the C/C++ source code. The HDL Editor window is presented in the figure below.
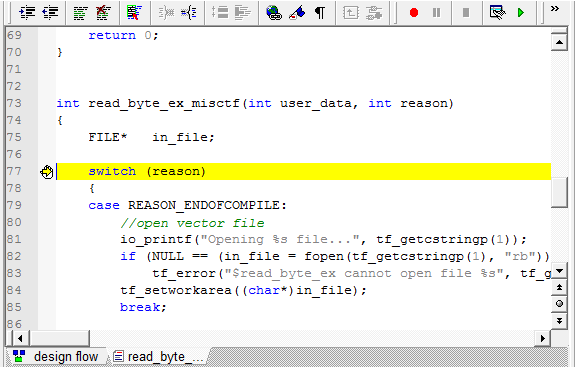
Figure 9. Encountered breakpoint
Each command executed from the C Code Debug window is echoed into the Console window. It also displays values returned by executed commands, which is shown in the figure below.
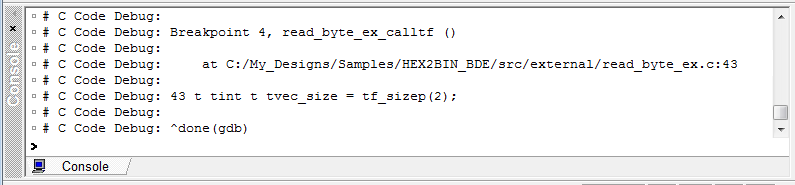
Figure 10. Console message of encountered breakpoint
You can also debug the C/C++ source code in the HDL Editor window by using the Trace Into
 , Trace Out
  , or Trace Over
  options from the Simulation menu or from the toolbar.
The C Code Debug window also allows you to observe functions and variables used in the C/C++ source code. The Call Stack tab allows you to view detailed information on subprograms and selected call stack objects declared in the code along with their values.
NOTE: To enable displaying objects on the Call Stack tab, you need to check the Enable Call Stack functions list option in the C Code Debug Settings category of the Design Settings window.
In the Watch tab (shown in Figure 8), you can add variables and observe their values during the debugging session. To add a variable:
Switch to the Watch tab.
Double-click the Expression column. This turns the editing mode on and you can enter the name of the item you want to observe e.g. in_file.
Press Enter to complete.
Repeat step #11 to add subsequent items e.g. chr, vec_size, and val (all the variables are defined in the read_byte_ex_calltf() function). Additionally, while entering the name manually, pay attention to the proper use of the character case since identifier names are case sensitive.
When you start debugging the read_byte_ex_calltf() function the Value column will display the current values of individual variables.
After you have reached the end of the debugging process, you may want to finish the session.
To close the debugging session, choose End Simulation from the Simulation menu or type in the endsim command in the Console window.
NOTE: Closing the VSimSA command prompt window does not terminate the debugger and it is not allowed during the debugging session.
Compiling C/C++ Source Code
The hex2bin_bde sample design delivers the read_byte_ex.c source file and the pre-compiled read_byte_ex.dll library that just has been debugged. All the files are stored in the \external subfolder.
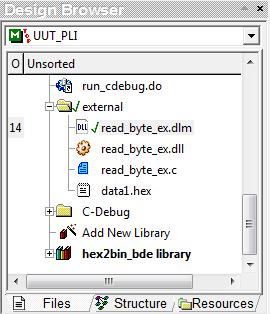
Figure 11. External folder within the Design Browser
However, if you wanted to modify this PLI application or debug another DLL you would need to (re)compile a C/C++ source file. Active-HDL also provides an interface to the GCC compiler that can be used to build user-defined VHPI/PLI applications.
Before you compile any C/C++ source code, you need to specify a configuration file for your application. This configuration is stored in a DLM file that contains information on sources to compile along with include files and all required libraries, compiler and linker options. The hex2bin_bde sample design delivers the pre-defined configuration file.
Expand the \external subfolder.
Double-click the read_byte_ex.dlm file. It opens the C/C++ Configuration window (if you would like to create a new configuration file, choose C/C++ Configuration from the File | New menu.
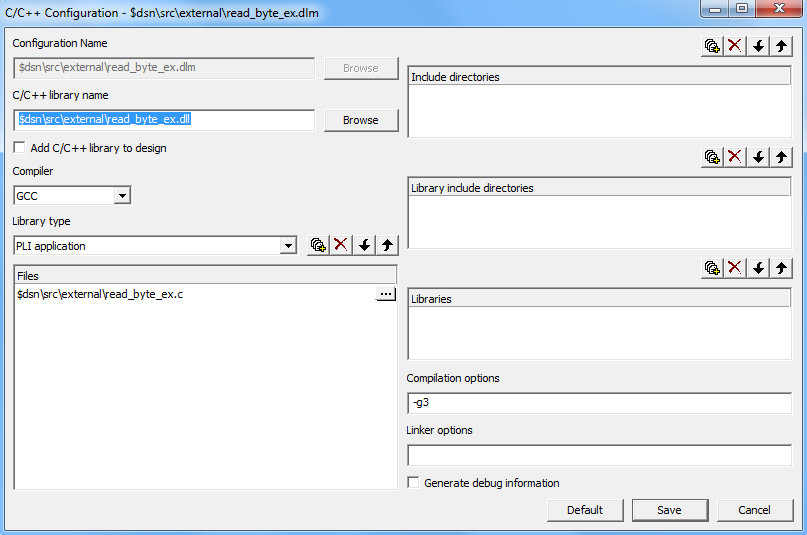
Figure 12. C/C++ Configuration window
In the C/C++ Configuration window, you can specify the name for the configuration file (DLM), your application (DLL), specify sources to be compiled including all required libraries, compiler, and linker options. When these options are specified, click Save to apply the changes. The DLM file is updated or, if you have just started creating a new configuration file, it is attached to the design tree as it is shown in the figure below.
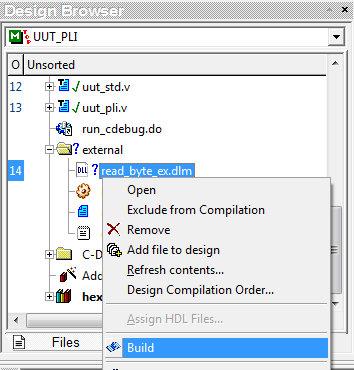
Figure 13. C/C++ Configuration window
To (re)compile the application right-click the DLM file, and choose Build from the context menu. This option starts the compilation of sources files specified in the Files pane of the C/C++ Configuration window. When the compilation is completed, the DLL file is updated or, if you have just started creating a new application, it is attached to the design tree.
Corporate Headquarters
2260 Corporate Circle
Henderson, NV 89074 USA
Tel: +1 702 990 4400
Fax: +1 702 990 4414
https://www.aldec.com
©2026 Aldec, Inc.